Bridging Digital and Physical: A Review and Tutorial for the UUNA TEK iDraw H SE/A3 Pen Plotter
Introduction: The Art of Plotting
As a software developer with a passion for art and design, I’ve always been drawn to the intersection of technology and creativity. In recent years, I’ve discovered the fascinating world of generative art, experimenting with tools like Processing, p5.js, and various creative coding techniques. These have provided a perfect bridge between my coding skills and artistic inclinations.
Pen plotters have been a particularly exciting discovery in my journey. These devices bring generative art full circle, transforming digital creations into physical artwork that can be appreciated by those less familiar with digital art – and they look great hanging on the walls at home! In 2023, I took my first step into the world of plotters with the UUNA TEK iDraw 1.0 A4, an excellent beginner-friendly machine. While it produced nice quality outputs, its limited size eventually left me wanting more.
Enter the UUNA TEK iDraw H SE/A3
Last month, I had the opportunity to explore the capabilities of the UUNA TEK iDraw H SE/A3, a new plotter model that UUNA TEK touts as “the ultimate special edition for artists seeking perfection in their work.” The company graciously provided me with this device for the purpose of testing and reviewing it. This review will share my comprehensive experience with the iDraw H SE/A3, from the initial unboxing to creating complex generative artworks, offering insights into its performance and potential for both hobbyists and professional artists alike.
There is currently a fall sale at Uunatek, plus you can use the coupon code ( LUCAVIP ) to get 15% off on any purchase at checkout.
Technical Specifications and Features
The iDraw H SE/A3 continues to utilize the efficient CoreXY design, a feature that has been a hallmark of iDraw plotters, ensuring enhanced precision and stability for both drawing and engraving tasks. This latest model, however, takes a step further with its all-in-one, pre-assembled design that’s ready to use straight out of the box, significantly simplifying the setup process for users.
One of the standout features of the H SE/A3 is its advanced control options. It supports both a Stand-alone Command Line Interface (CLI) and an iDraw Python API, providing flexibility for advanced users and enabling seamless integration with custom Python scripts. This opens up a world of possibilities for creative coding and automation.
The plotter’s redesigned base plate is another noteworthy improvement, accommodating various paper sizes from A5 to A3 with easy home point and drawing size positioning. This versatility is complemented by a generous working area, boasting a usable pen travel of 420 × 297 mm (A3 size) and 15 mm of vertical pen travel, allowing for diverse artistic expressions.
While the plotter has plenty of space and the marks on the baseplate are a godsend to help quickly position the paper, I would have liked if the baseplate had a little more space around the plottable area to be able to use the FA4 fabriano sheets. These come in a 480mm by 330mm size and I feel they are the perfect size to output a full A3 artwork with a nice border. I was able to use them but placing the sheet was a bit more work than I would have liked.
In terms of performance, the H SE/A3 doesn’t disappoint. It offers high-speed operation with a maximum XY travel speed of 15 inches (38 cm) per second. The plotter’s precise movements are ensured by a native XY resolution of 2032 steps per inch (80 steps per mm), resulting in exceptional accuracy. At low speeds, it typically achieves reproducibility (XY) better than 0.005 inches (0.1 mm), making it suitable for even the most detailed artwork.
These technical specifications, while impressive on their own, come together to create a plotter that’s not just a tool, but a reliable partner in bringing digital art into the physical realm.
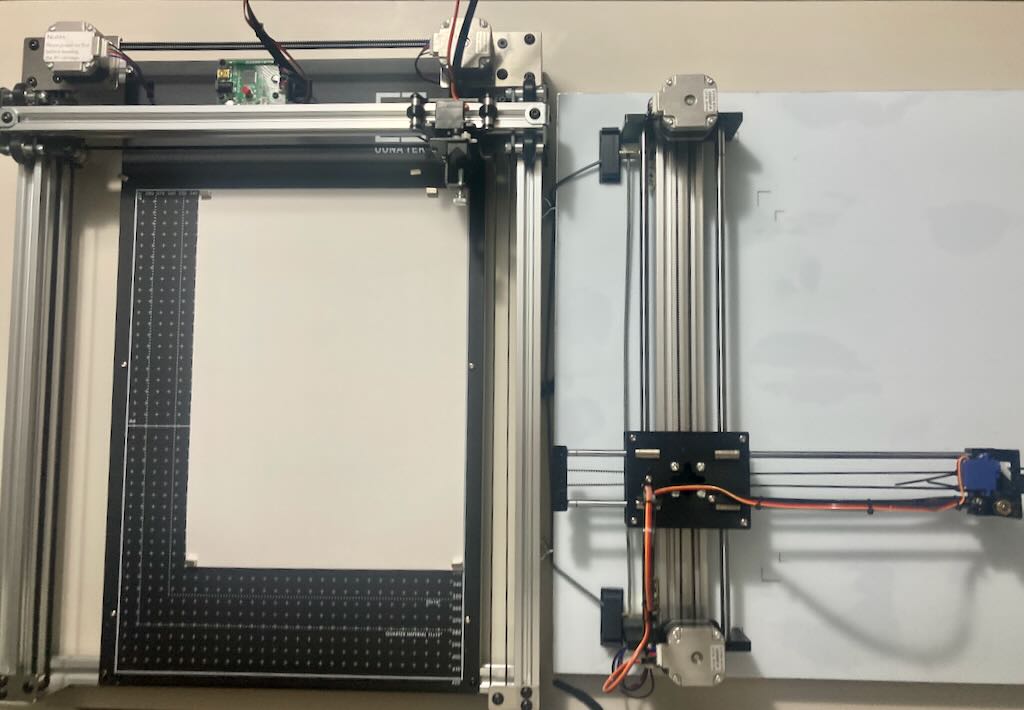
The Machine’s Design
The iDraw H SE/A3 features a robust H-shaped frame with an integrated base, making it more stable and easier to move than some other plotter designs. Its sturdy construction not only enhances durability but also contributes to the machine’s precision and reliability during operation.
Unboxing and Setup
When the plotter arrived from China after about 10 days, I was excited but also a bit concerned due to the beaten-up appearance of the package. Upon careful unboxing, I found that while the plotter was packaged nicely, there wasn’t much protective stuffing. Fortunately, the machine’s sturdy construction prevented any significant damage, though a few screws were loosened, and one of the belts had come out of its rails.
The documentation provided is minimal, as the machine is designed to be plug-and-play. However, UUNA TEK offers a comprehensive library of unboxing and setup videos on their YouTube channel, which proved invaluable during the initial setup.
Using the guidance provided in the setup videos, I carefully addressed the loose belt issue. I gently maneuvered the belt back onto its proper track, ensuring it was correctly seated in the pulleys and tensioners. Once the belt was in place, I tightened the screws that had come loose during shipping. After these adjustments, I manually moved the plotter’s arm to test its motion. The smooth, resistance-free movement confirmed that the belt was correctly positioned and tensioned, and the machine was ready for its first test run.
Setup Steps:
Setting up the iDraw H SE/A3 is a straightforward process that begins with finding a suitable location. Choose a flat, stable surface to place the plotter, ensuring it has enough room for operation. Once positioned, connect the plotter to your computer using the provided USB cable, and plug in the power supply to bring the machine to life.
The next step involves software preparation. If you haven’t already, install Inkscape on your computer, as this will be your primary interface for controlling the plotter. With Inkscape in place, you’ll need to enhance its functionality specifically for the iDraw H SE/A3. This is done by downloading and installing the custom Inkscape extensions, which are conveniently provided via a Google Drive link. These extensions bridge the gap between Inkscape’s vector graphics capabilities and the plotter’s hardware, allowing for seamless communication and control.
Creating Artworks for the Plotter
There are several ways to create artwork for the iDraw H SE/A3:
- SVG Vector Graphics: The easiest method is to design your artwork in SVG format using vector graphics software.
- Algorithmic Art: For generative artists, p5.js is a popular library. You can use the p5.js-svg library to generate SVG output from your p5.js sketches.
- Photo-to-Line Art: To plot photos, you’ll need to convert them to line art vector files. DrawingBot v3 is an excellent tool for this process.
I’ve tested the plotter with one for each of these cases:
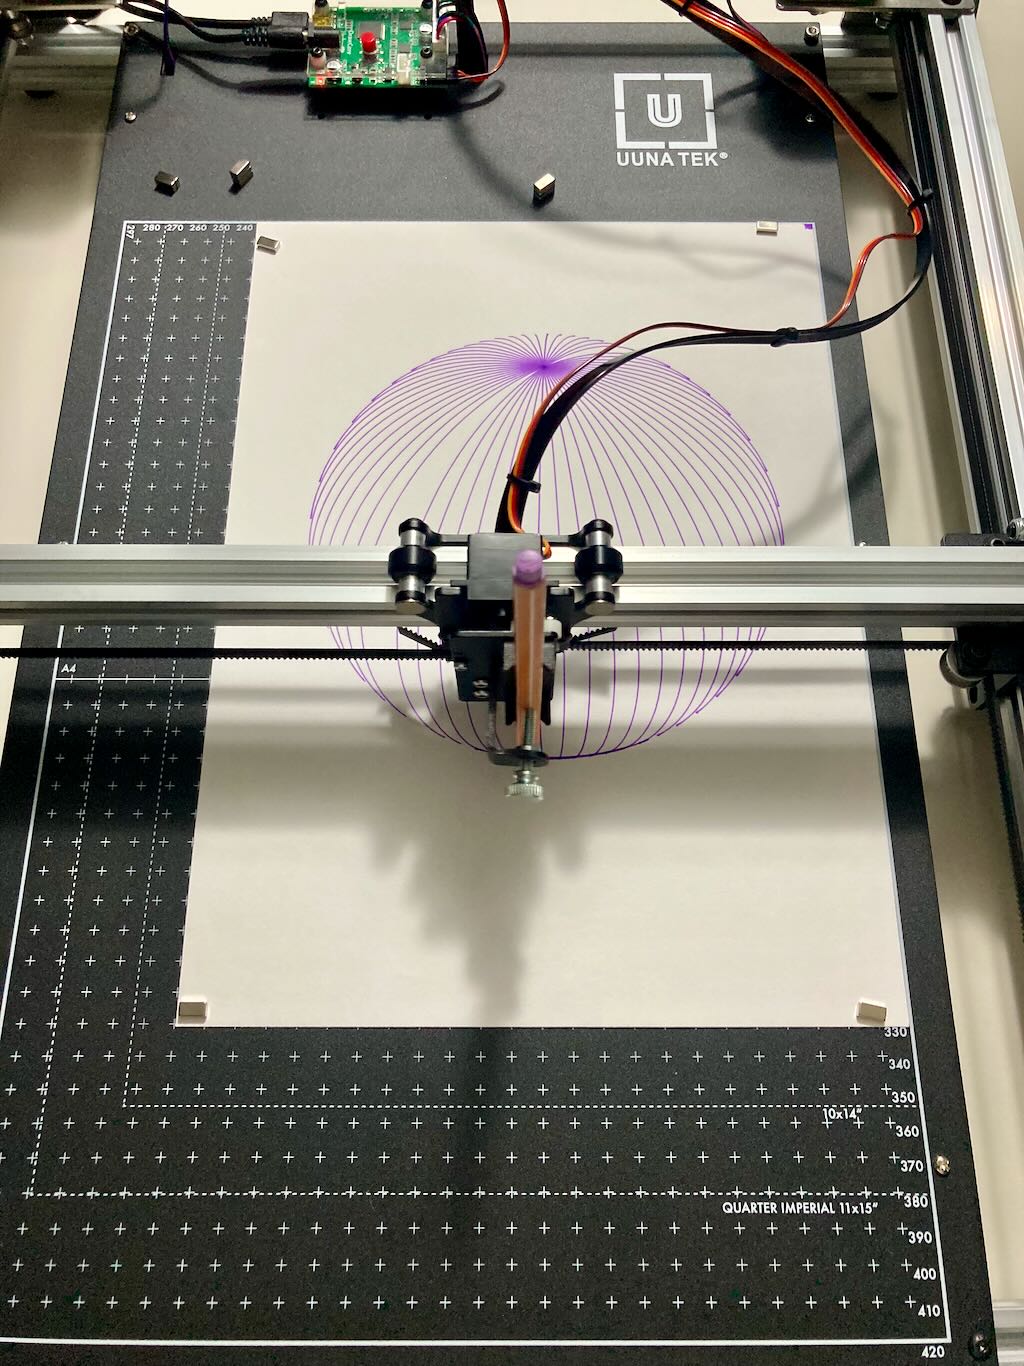
A simple static SVG of a sphere
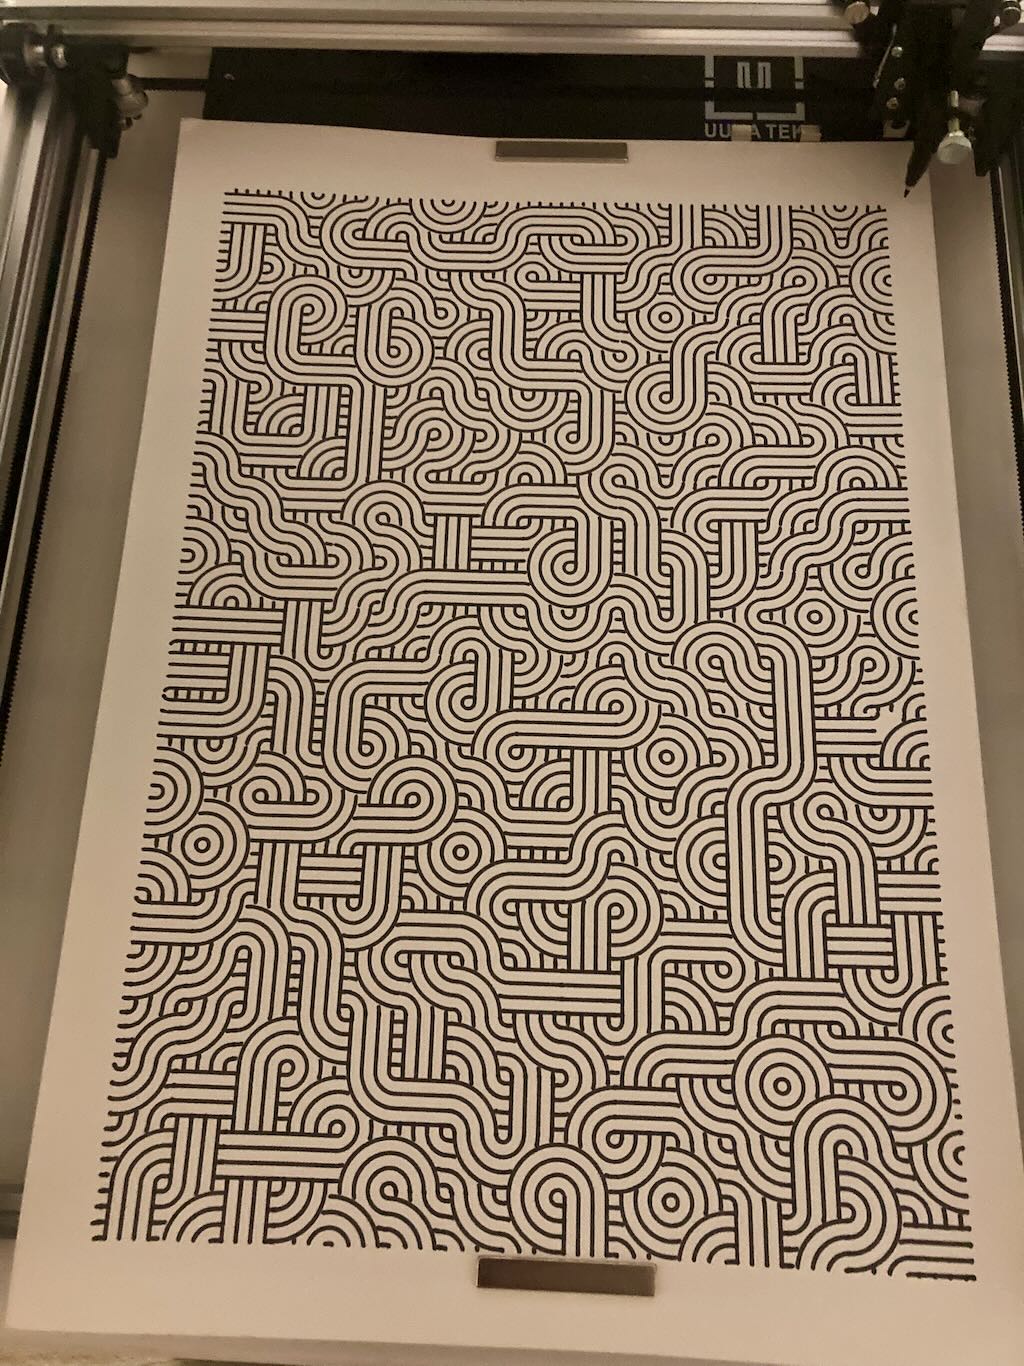
A truchet tile generated from my own p5js code
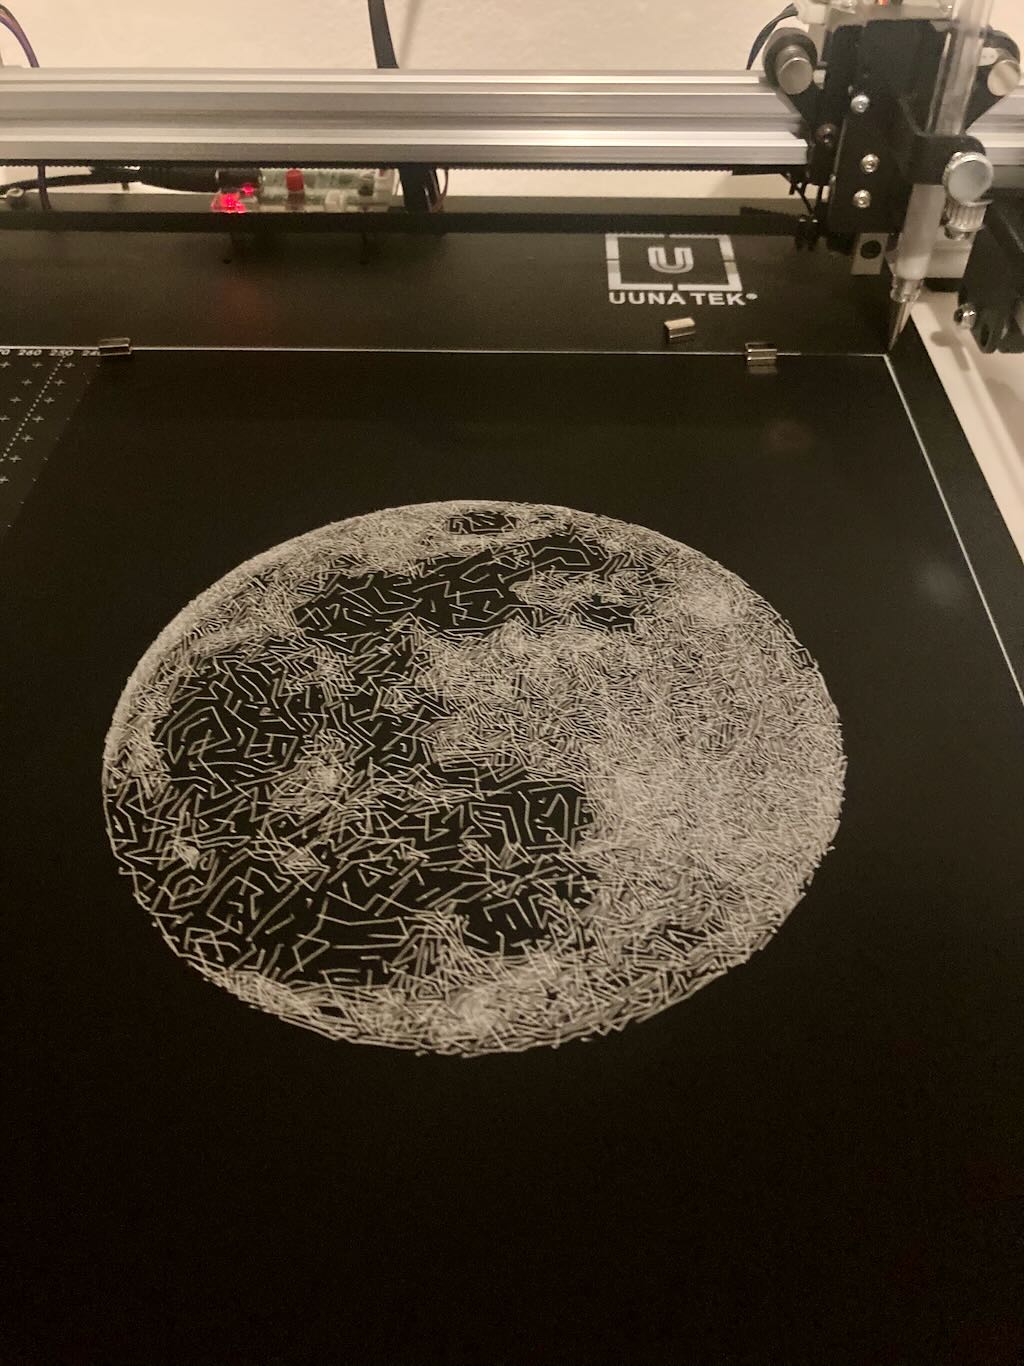
An line-art SVG obtained processing an image of the moon I took months ago
Printing from Inkscape
Once your artwork is ready, follow these steps to plot it:
- Ensure your SVG file matches the size of your chosen paper.
- Position the paper on the base plate, aligning the top-right corner with the drawing area’s top-right corner.
- In Inkscape, navigate to Extensions > iDraw HSE Control and select the Setup tab.
- Use the “Toggle Pen between UP, DOWN” option to test the pen movement.
- Insert your pen into the holder (in the UP position) and adjust its height.
- Use the toggle command to lower the pen and check its contact with the paper.
- Switch to the plot tab in the extension and click “Apply” to start plotting.
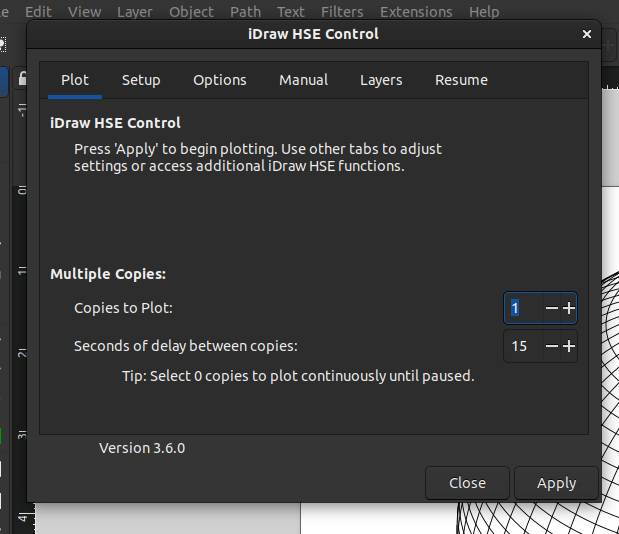
The Inkscape extension offers various customization options, including:
- Pen height adjustments for up and down positions
- Drawing speed settings (separate for pen up and pen down movements)
- Acceleration control
- Path optimizations (connecting adjoining paths, sorting, and reversing)
- Layer-by-layer plotting for multi-color artwork
Programming the Plotter
The availability of an API for the iDraw H SE/A3 opens up a world of possibilities for artists and developers alike. One of the most significant advantages is the ability to implement version control for designs, code, and configurations. This means you can track changes over time, collaborate with others, and easily revert to previous versions if needed, bringing software development best practices into the realm of physical art creation. This is really important when experimenting with new design ideas and new algorithms!
Remote plotter operation becomes a reality with API control, allowing you to connect the plotter to a headless computer (like a small RaspeberryPI) and send commands to your plotter from your main studio computer. This feature is particularly useful for long-running plots or for operating multiple plotters or designs.
Perhaps most exciting is the potential for complex pattern programming. With direct access to the plotter’s functions through code, you can create intricate, algorithmic designs that would be difficult or impossible to achieve through traditional design software alone. This capability estends what you can do with the physical output, allowing you to explore mathematical concepts, random processes, or data-driven designs in your plotted artwork and to mix these with a larger selection of drawing techniques. You could, for instance, create plots that respond to real-time data feeds, or develop your own custom software that generates unique designs for each plot. Direct movement programming makes also easier to use paint and a brush instead of pens since it allows more freedom to program in phases of movements to re-load the paint or wet the brush between two sets of strokes.
The plotter can be controlled via a command-line interface or a Python API.
If you’re new to using plotters with programming libraries, you might find the initial setup a bit confusing. Don’t worry—this guide will walk you through the process step by step.
Finding the Right Libraries
I was a little confused at the beginning, as I did not find any references to the APIs or programming libraries on the official website. However, it turns out that the plotter is fully compatible with the libraries for the AxiDraw plotter! This compatibility makes the setup process much simpler.
Prerequisites
I had already installed these libraries for post-processing my SVGs to remove hidden lines. Let’s walk through the installation process for those who haven’t done so yet.
To get started, you’ll need Python 3 installed on your computer. While I won’t cover the Python installation process here, there are plenty of tutorials available online. If you prefer, you can set up a dedicated environment for this project. Once you have Python set up, you’ll need to download and install the required library.
Installation Process
In the following examples, I’ll demonstrate the commands used to set up the API from a command line shell. I’m using Linux, but MacOS and Windows users can follow similar steps with their respective command line interfaces. Keep in mind that some commands may vary slightly depending on your operating system.
The official install package for the command line and the python module is at:
https://cdn.evilmadscientist.com/dl/ad/public/AxiDraw_API.zip
and the last released package as of this writing is version 3.9.6.
you can install it with (right from the remote URL):
pip install https://cdn.evilmadscientist.com/dl/ad/public/AxiDraw_API.zip
or by downloading the package, unzipping it and running the pip install command directly
curl -o AxiDraw_API.zip https://cdn.evilmadscientist.com/dl/ad/public/AxiDraw_API.zip
unzip AxiDraw_API.zip
cd AxiDraw_API_396
pip install .
Command Line Usage:
To send and SVG file to the plotter for drawing, you simply call the command line tool with no other parameters:
axicli images/sphere.svg
This assumes the default mode of operation “plot”, you can pass an option to change the mode of operation and for example plot a single layer:
axicli images/sphere.svg --mode=layers --layer=2 # Plot a single layer (plots the layer numbered "2")
The modes available correspond roughly to the tabs and commands in the Inkscape extension popup. For example you can raise the pen if it is lowered, or vice versa:
axicli images/sphere.svg --mode=toggle
An important option to pass is the “model” option to select the right model of the plotter. This is used to set the boundaries of the plotter movements:
axicli images/sphere.svg --model 2 # Selects the A3 model (default is equal to 1 which select A4)
You can even collect a set of customized options in a file custom_conf.py:
mode = 'plot'
pen_pos_up = 55         # Height of pen when up
pen_pos_down = 25       # Height of pen when down
model = 2
and run your plot applying these parameters:
axicli images/sphere.svg --config ./custom_conf.py
Other interesting options allow you to show a progress bar to monitor the plotting process which is very nice when creating a complex design or when running at reduced speed:
axicli images/sphere.svg --progress
here is an example output:
Plot Progress: 15%|####3 | 2376/15203 [01:31<06:55, 43.11 mm/s]
Last option I want to outline is the webhook option. As the name suggests, it allows you to have the computer call a web URL when the plot terminates or pauses.
axicli images/sphere.svg --webhook --webhook_url "https://example.com/notify"
I’m planning to use it to get notified of the plotter completing the work when I need to leave it unattended.
Python API Usage
The command line is actually a (thin) wrapper around a library that allows direct control of the plotter functions from python programs. All of the features of the command line are available directly from code, starting from SVG plotting and options setting.
The API has two modes of operation: plot and interactive. The plot mode requires an SVG input either as a file or directly as SVG content embedded in the code. The minimal code to draw an image from a file requires you to instantiate the AxiDraw object, call plot_setup() and finally plot_run():
from pyaxidraw import axidraw
ad = axidraw.AxiDraw()
ad.plot_setup("images/sphere.svg")
ad.plot_run()
Options may be set at any point after plot_setup() and before plot_run().
from pyaxidraw import axidraw
ad = axidraw.AxiDraw()
ad.plot_setup("images/circle.svg")
ad.options.model = 2 # Sets the plotter size, valid: 1 = A4 (default), 2 = A3, ...
ad.options.speed_pendown = 10 # Slow down operation of the plotter
ad.options.pen_pos_down = 20
ad.options.pen_pos_up = 50
ad.plot_run()
Plotting a single layer requires adjusting the mode option and selection which layer to plot:
from pyaxidraw import axidraw
ad = axidraw.AxiDraw()
ad.plot_setup("images/sphere.svg")
ad.options.mode = "layers"
ad.options.layer = 3
ad.plot_run()
The interactive mode of operation accepts direct XY motion control commands and works from within a Python script.
A call to the interactive() method starts the interactive mode. This should be followed by a call to the connect() method that start thje itneracativ session which persists until a call is done to the disconnect() method.
from pyaxidraw import axidraw
ad = axidraw.AxiDraw()
ad.interactive() # Enter interactive context
if not ad.connect(): # Open serial port to AxiDraw;
    quit()

ad.moveto(2, 1) # move to (2 inch, 1 inch)
ad.lineto(3, 3) # draw a line to (3 inch, 3 inch)
ad.moveto(0, 0) # Pen-up and back to origin.
ad.disconnect()
Options may be specified after the interactive() call and they will be applied when you call connect(). Any option set after the call to connect will not be immediately applied, you have to call the update() method to apply them.
While in interactive mode you can use a number of methods to draw and move the pen around, from the documentation:
goto()Absolute move to (x,y) location.moveto()Absolute pen-up move to (x,y) location.lineto()Absolute pen-down move to (x,y) location.go()Relative move of distance (Δx,Δy).move()Relative pen-up move of (Δx,Δy).line()Relative pen-down move of (Δx,Δy).penup()Raise the pen.pendown()Lower the pen.draw_path()Draw a path defined by a coordinate list.
Here is a more complex example using math and the API to draw a flow field on the page:
import math
import random
from pyaxidraw import axidraw

# Initialize AxiDraw
ad = axidraw.AxiDraw()
ad.interactive()
ad.options.units = 2  # Set mm units
if not ad.connect():  # Open serial port to AxiDraw
    quit()  # Exit, if no connection

# A3 page dimensions in mm
PAGE_WIDTH = 420
PAGE_HEIGHT = 297
BORDER = 20  # 2cm border

# Calculate drawing area
DRAW_WIDTH = PAGE_WIDTH - 2 * BORDER
DRAW_HEIGHT = PAGE_HEIGHT - 2 * BORDER

# Flow field parameters
RESOLUTION = 10  # mm between each grid point
NOISE_SCALE = 0.01
NUM_PARTICLES = 500
STEP_SIZE = 2  # mm

def noise(x, y):
    # Simple noise function (you might want to use a better one like Perlin noise)
    return math.sin(x * NOISE_SCALE) * math.cos(y * NOISE_SCALE)

def get_angle(x, y):
    return noise(x, y) * 2 * math.pi

def in_bounds(x, y):
    return BORDER <= x <= PAGE_WIDTH - BORDER and BORDER <= y <= PAGE_HEIGHT - BORDER

# Generate and draw the flow field
for _ in range(NUM_PARTICLES):
    x = random.uniform(BORDER, PAGE_WIDTH - BORDER)
    y = random.uniform(BORDER, PAGE_HEIGHT - BORDER)
    vertices = [[x,y]]
    for _ in range(100):  # Maximum 100 steps per particle
        angle = get_angle(x, y)
        new_x = x + math.cos(angle) * STEP_SIZE
        new_y = y + math.sin(angle) * STEP_SIZE

        if in_bounds(new_x, new_y):
            vertices.append([new_x, new_y])
            x, y = new_x, new_y
        else:
            break
    ad.draw_path(vertices)

# Return to home position
ad.moveto(0, 0)

# Disconnect
ad.disconnect()

print("Drawing complete!")
As you can see having a programmable interface may increase the ways you can create with your plotter and the A3/SE is the perfect companion to use.
Pros and Cons
A review would not be such without a pros and cons list, so here we go:
Cons:
- Packaging could be improved to better protect the device during shipping
- While the video library is helpful, written documentation would be preferable
- A base larger than the maximum drawable space would be ideal for easier paper positioning
Pros:
- Sturdy construction and stable H-form factor
- Ideal size with excellent precision and speed
- Integrated base makes it easier to move and less prone to misalignment
- Programmability adds flexibility and opens new creative avenues
Conclusion
The UUNA TEK iDraw H SE/A3 is a significant step up from entry-level plotters, offering a perfect balance of size, precision, and advanced features. Its programmability and robust construction make it an excellent choice for generative artists looking to bring their digital creations into the physical world.
While there’s a learning curve involved in mastering the nuances of different pens, papers, and programming options, the results are well worth the effort. The iDraw H SE/A3 opens up new creative possibilities, allowing artists to explore the fascinating intersection of generative art and traditional media.
Whether you’re a seasoned generative artist or just beginning to explore this field, the UUNA TEK iDraw H SE/A3 offers a powerful tool for translating your digital visions into tangible, one-of-a-kind artworks. Happy plotting!
Don't forget, use the coupon code ( LUCAVIP ) to get 15% off on any purchase at checkout at https://uunatek.com